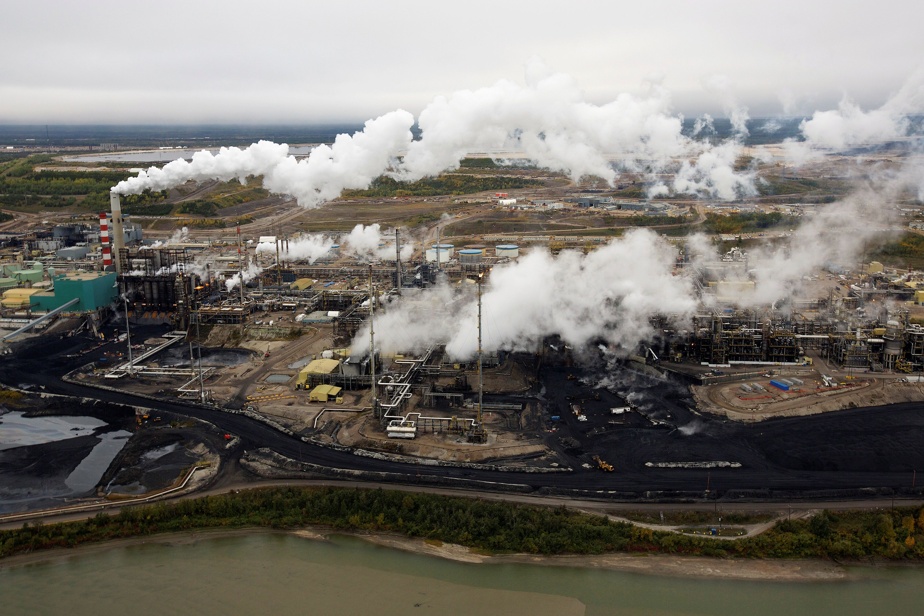
New federal data suggests greenhouse gas emissions from Alberta’s oil sands may be significantly underestimated, adding to a growing number of studies that indicate our understanding of what’s going on in the atmosphere is incomplete.
In an article published last week in a major American science journal, Environment and Climate Change Canada researchers used new ways of measuring oil sands emissions that yielded numbers at least 65% higher than those reported by industry.
“We found that [the emissions] are higher than the CO2 estimates that are reported in the greenhouse gas reporting program,” said lead author Sumi Wren of Environment Canada.
The paper, published in the journal Proceedings of the National Academy of Sciences, describes how the researchers combined measurements from flybys, satellites and historical data to reach their conclusions.
In 2018, the team conducted 30 flights over the oil sands region to establish the relationship between nitrogen oxides and carbon dioxide in industry emissions. This ratio matched that derived from similar flights in 2013. They then developed estimates of nitrogen dioxide emissions from 2005 to 2020 by combining satellite data with industry-reported values.
Using this historical record and the constant ratio of these gases to carbon dioxide, the team was then able to calculate how much carbon dioxide had been released over the years.
Their figures suggest that the tar sands could release around 31 million tonnes of unreported carbon dioxide into the atmosphere per year. Moreover, this potential under-reporting dates back to at least 2018.
Their margin of error is eight million tonnes in either direction.
But the difference between their numbers and the numbers reported by the industry is big enough to suggest something is going on.
“The gap is quite significant,” Ms. Wren said. It’s big enough to underscore the need to understand why we see this. »
Industry typically estimates its emissions by comparing known inputs to outputs, with offsets for leaks and other fugitive releases – a so-called “bottom-up” approach. The method is considered reliable and accurate, said co-author John Liggio, also of Environment Canada.
“The bottom-up method is pretty good,” he said.
But when researchers use atmospheric measurement — the “top-down” approach — they consistently get higher readings from everything they study. This pattern has appeared in articles on emissions of methane, soot, volatile organic compounds, and sulfur dioxide.
Mark Cameron of the oil sands group Pathways Alliance criticized the study.
“We strongly caution against interpreting this study that aerial air sampling […] is a better approach to estimating emissions,” he argued, adding that industry uses standard practices used around the world.
“Inherent weaknesses in the research methods diminish our confidence in its results. »
Mr. Cameron described the use of a single ratio as simplistic. He pointed out that the number of flights was insufficient and that the study did not take into account the days when the oil sands sites were closed for reasons such as maintenance.
But John Liggio said the difference between the two measurement systems is significant enough to require an explanation.
“Both bottom-up and top-down approaches have their inherent uncertainties,” he recalled. The top-down approach is a complementary way to identify if there are gaps. »
“We need to start thinking about using atmospheric measurements with the bottom-up approach. It’s coming, but we’re not there yet. »

