“The effects of heat are largely influenced by a person’s ability to access resources, particularly adequate housing,” says Canada Mortgage and Housing Corporation (CMHC), which funded this interactive map. detailing 156 urban areas, a first in the country. The online application allows you to explore cities and their neighborhoods according to six distinct criteria, including the location of heat islands, and the areas where vulnerable populations are most exposed to heat.
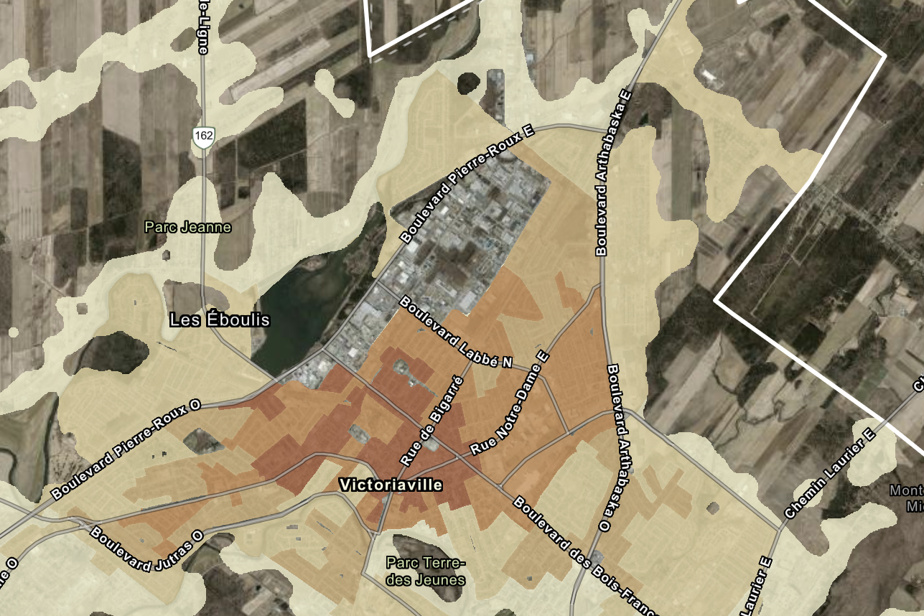
One of the map options allows you to see the combined effect of two indices, namely exposure (which notably takes into account the vegetation, the built environment and the impermeability of the soil) and the vulnerability (of the population to heat waves). People “very exposed and very vulnerable are really the populations on which we should have an eye”, explains Professor Nathalie Barrette, director of the certificate in sustainable development at the Faculty of Forestry, Geography and Geomatics of Laval University. The au gratin brown hue, which represents the highest degree of this index, is very common in the Montreal metropolitan area.
During heat waves, average temperature differences between an urban setting and nearby rural areas can exceed 10 degrees Celsius, heat island mapping shows. Important information for citizens, but also for those responsible for public health and urban planning, as well as for elected officials. “If I have a budget to redo greening, I may plan more measures in those areas,” says Professor Barrette.
Big cities aren’t the only ones likely to be affected by heat waves, Barrette points out. “It may seem surprising, but when you look closely, you see that the downtown areas of small municipalities, such as Saint-Georges, Victoriaville or Drummondville, are often very vulnerable. They are in the region, but their territory is extremely sealed. The exposure index, which takes into account multiple data (temperature and impermeability of the ground, vegetation, built environment, altitude, proximity to water, etc.) can thus be very dark in the heart of small towns…
The heat wave that hit British Columbia in the summer of 2021 claimed 619 lives, including 117 in Vancouver, 75 in Surrey and 73 in Burnaby. The one that affected Laval in the summer of 2018 was found to be responsible for 15% of the deaths that occurred during this period (12 out of 79). Three quarters of these victims lived in areas said to be highly vulnerable to heat waves, such as Pont-Viau, Renaud-Coursol and Laval-des-Rapides. “People living in areas of high vulnerability […] were 1.5 times more likely to die than those in areas of less vulnerability,” concluded the Laval Public Health investigation report.
Heat waves are more and more frequent in Canada, warn researchers from the Department of Geography at Laval University. “During the period 2051 to 2080, some regions will observe more than 50 days per year with mercury reaching 30 degrees Celsius,” they report in a video clip. This is what climate models project for cities like Montreal (53 days), Toronto, Ottawa, Regina or Winnipeg. But it’s Windsor, Ontario that takes the palm (or the palm?), with a projection of 75 days of over 30 degrees annually.

